


Reversal And Continuation Chart Patterns
Reversal And Continuation Chart Patterns
Published 11/2025
Duration: 2h 6m | .MP4 1280x720 30 fps(r) | AAC, 44100 Hz, 2ch | 627.55 MB
Genre: eLearning | Language: English
Published 11/2025
Duration: 2h 6m | .MP4 1280x720 30 fps(r) | AAC, 44100 Hz, 2ch | 627.55 MB
Genre: eLearning | Language: English
Understanding the chart patterns inside out
What you'll learn
- An understanding and mastery of proven key reversal chart patterns, how and where to identify and trade them profitably
- An understanding and mastery of proven & key continuation chart patterns, how and where to identify and trade them profitably
- Be able to identify chart patterns and price formations on both line charts and candlestick charts seamlessly
- Be able to identify, confirm and trade the various continuation and reversal chart patterns in the market
- Know the best and high probability regions of the market and price formations to look for or anticipate them
- Be able to determine the best entry points in to favorable trades and exits out of unfavorable positions via chart pattern formations
- Attain proficiency in price analysis and prediction via chart pattern formation.
Requirements
- Zero to basic knowledge of technical analysis and price formations
Description
REVERSAL AND CONTNUATION CHART PATTERNS
A must before trading & investing in the markets!
Trading without the knowledge of the various chart patterns and price formations is like flying blind in the market, taking risk without due diligence, gambling or trading at the mercy of luck in the markets.
Chart patterns give cues to impending price direction upon formation or appearance on the price chart. In other words, they act as pointers to the impending or future direction price is bound to move in the market.
An accurate prediction of price direction in the markets, is a function of an understanding and mastery of the various chart patterns formed in the course of price development.
A chart pattern on a candlestick chart, represents the aggregation of candlesticks in to a defined pattern or symmetry which determines the direction and behavior of price upon its formation on the price chart.
If candlesticks were letters of the alphabets, then chart patterns represent the meaningful and predictive words and sentences formed by the combination of the candlesticks.
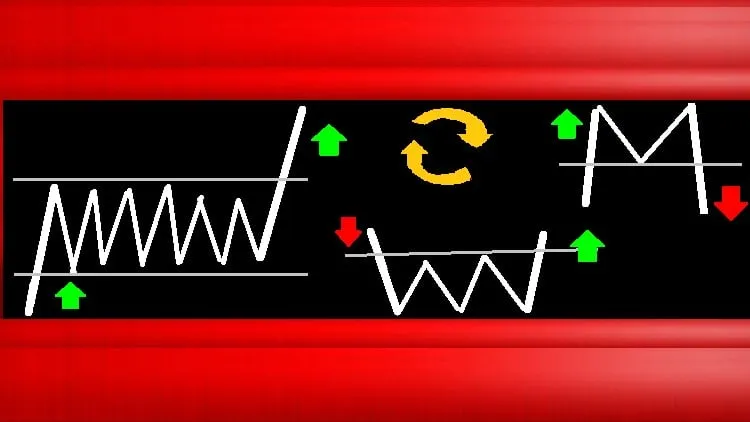
A chart pattern can be acontinuationor areversalpattern.
A continuation chart pattern, hints the resumption or continuation of price in its initial or original path or direction of movement following a price stall or consolidation. A reversal chart pattern on the other hand signals a turnaround or deviation from the initial path of price movement to move in an entirely different or new direction.
An understanding and mastery of the various continuation and reversal chart patterns, helps a trader to:
Trade deliberately and with more control over the trading process.
Spot more and better trade execution opportunities in the market.
Remove gambling approach from trading.
Understand price formation on the price chart inside out.
Know when and where to open a trade or position and when and where to get out of one on the basis of the pattern formation on the price chart.
Reduce the waiting time and forcing of trades
Take only high probability trades and trade set ups void of guess work
Trade with more consistency and precision.
Upon completing this course, a would be trader, novice and moderately experienced trader will;
Be able to seamlessly read, identify and trade the various and key continuation and reversal chart patterns formed by price in the course of its development in the market.
Be able to determine and find the best entry points in to favorable trades and exits out of unfavorable positions via chart pattern formations
Trade with more clarity, confidence and consistency.
Identify chart pattern formations on both line charts and candlestick charts.
Attain proficiency in price analysis and prediction via chart pattern formation.
Trust in charts!
Who this course is for:
- Would-be, novices and moderately experienced traders speculators and investors of the markets
- Traders and market participants looking for the best tools for forecasting and predicting price direction in the markets
- Traders looking to understand and master chart patterns and price formation
- Traders with zero to little knowledge of price formation and development
More Info