


Visualize Data Using Grafana
Visualize Data Using Grafana
2024-12-15
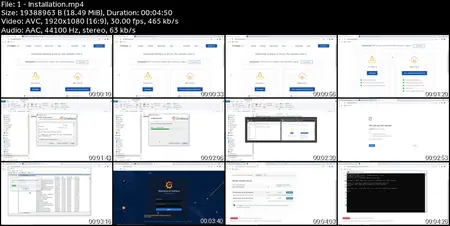
MP4 | Video: h264, 1920x1080 | Audio: AAC, 44.1 KHz
Language: English (US) | Size: 1.72 GB | Duration: 5h 42m
2024-12-15
MP4 | Video: h264, 1920x1080 | Audio: AAC, 44.1 KHz
Language: English (US) | Size: 1.72 GB | Duration: 5h 42m
Comprehensive course to visualize and analyze data using dashboards and panels of Grafana
What you'll learn
Visualize the data
Analyze the data
Requirements
Basics of query writing
Description
One of the important aspect of business analysis is analyze the data. Though there are many technologies to process the data which is present in underlying database, visualizing the same was always a challenge.Grafana is one of the most appealing tool or framework which facilitates the visualization of your data, using which you can read your data more graphically so as to make the quick decisions. It provides different features like dashboards, panels using which you can create different charts which represents the status of your data. During this entire course, we are going to learn how to create dashboards and panels in Grafana and how to create different types of charts like gauge, heatmap and many more. Along with this we will be also talking about how to create automated alters and notify those alerts to the stakeholders if there is something wrong observed in system. As a Grafana designer you will be able to create different types of graphs and will able to set up the users, teams and their permissions. So, if you want to learn Grafana and visualize the data this course is best choice for you.
Who this course is for:
Anyone who want to analyze and visualize data
Visualize Data Using Grafana
