
Data Visualization Tips and Tricks
Data Visualization Tips and Tricks
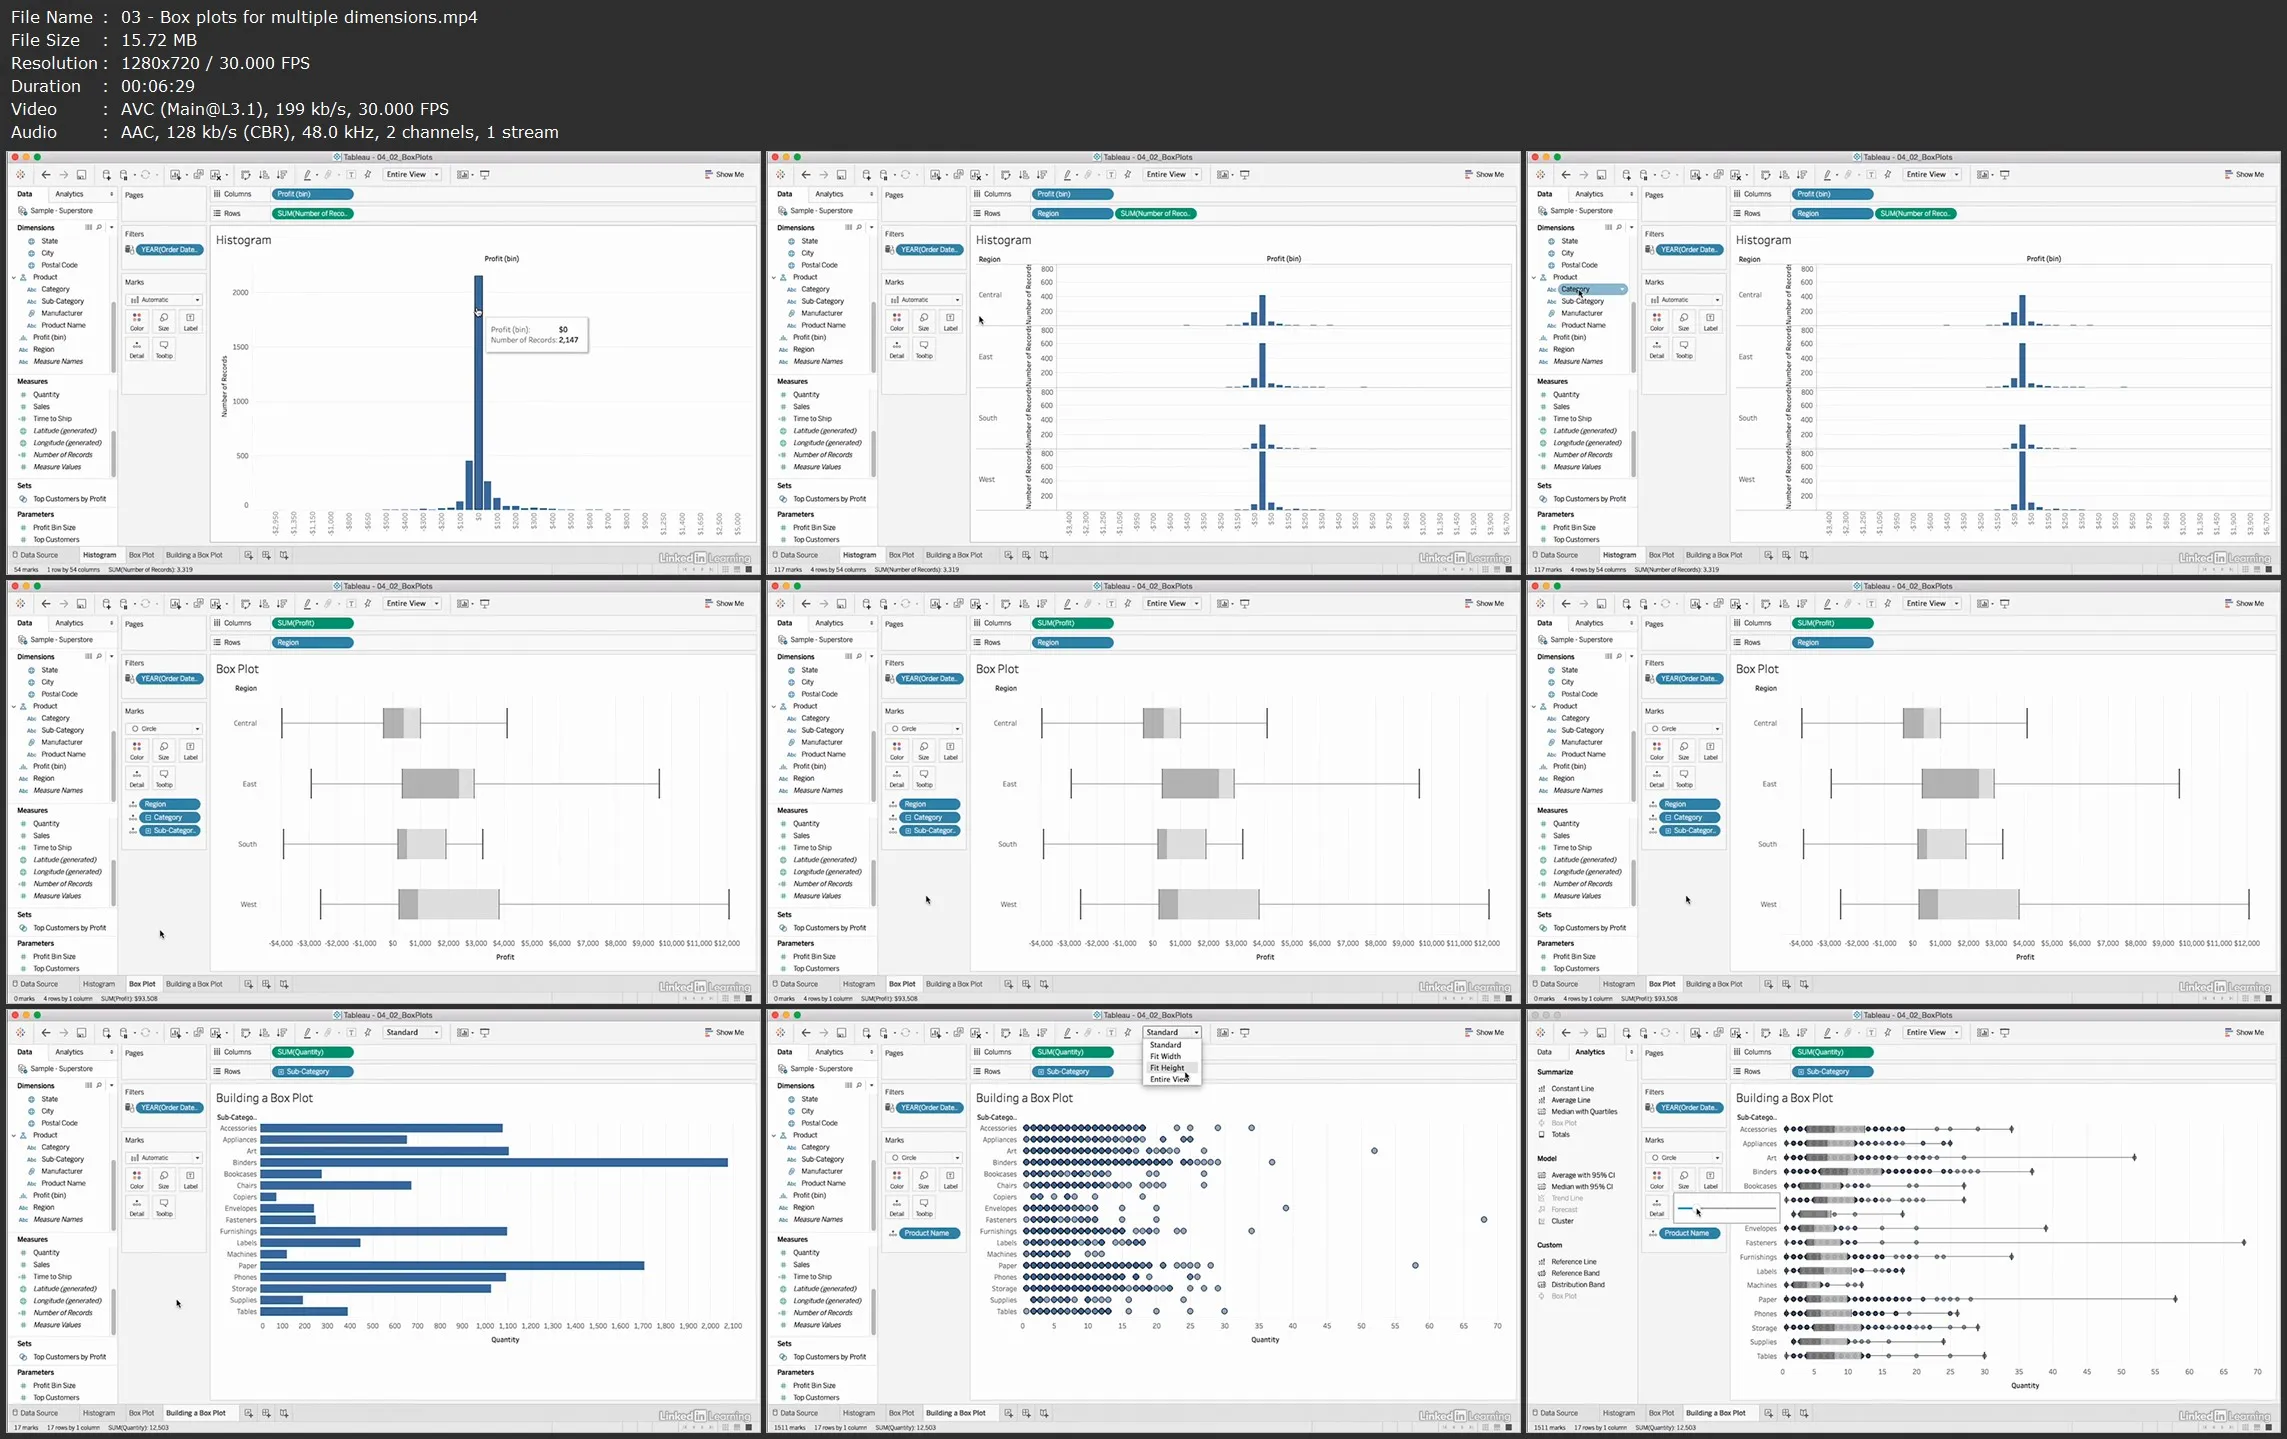
.MP4, AVC, 1280x720, 30 fps | English, AAC, 2 Ch | 2h 14m | 631 MB
Instructor: Matt Francis
.MP4, AVC, 1280x720, 30 fps | English, AAC, 2 Ch | 2h 14m | 631 MB
Instructor: Matt Francis
Data Visualization Tips and Tricks is a series of standalone lessons on how to do data viz the right way, every time. Presented by award-winning data visualization expert (and Tableau-designated "Zen Master") Matt Francis, this software-agnostic course is designed for experienced data scientists and analytics specialists and serves as a must-have bank of knowledge and best practices. Learn how to choose the right visualization for your data, and answer the 5 key questions you should ask yourself at the beginning of every project.
Topics include understanding the relationships between data sets, making comparisons, charting relationships, visualizing data distributions, creating maps, and—most valuably—knowing when to use which types of graphs and charts. Matt also teaches you how to understand what others are doing with their own visualizations, ask informed questions, and look with a critical eye at the work of others.
Learning objectives
- Explain the importance of data visualization.
- Determine when an infographic or an exploratory dashboard would be most appropriate.
- Identify the elements of a Gantt chart.
- Recall the characteristics of four kinds of distribution.
- Recognize the drawbacks of using a pie chart.
- Explain when to use a symbol map.
Data Visualization Tips and Tricks