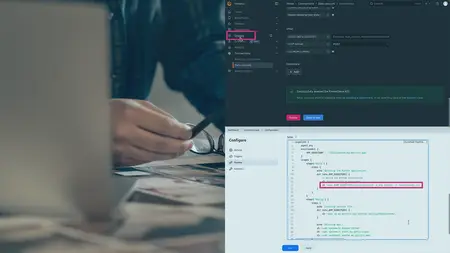
b]DevOps Troubleshooting: Using Monitoring and Logging
Published 6/2025
MP4 | Video: h264, 1920x1080 | Audio: AAC, 48 KHz
Language: English | Size: 158 MB | Duration: 42m 43s
Published 6/2025
MP4 | Video: h264, 1920x1080 | Audio: AAC, 48 KHz
Language: English | Size: 158 MB | Duration: 42m 43s
This course provides a comprehensive exploration of DevOps troubleshooting through the implementation and integration of robust monitoring and logging solutions. You will learn to deploy and configure Prometheus and Grafana for metric visualization and alerting, and master the ELK stack (Elasticsearch, Logstash, Kibana) for effective log management and analysis. Furthermore, the course delves into the integration of these tools within CI/CD pipelines to ensure the reliability and performance of your applications. Upon completion, you will possess the practical skills to proactively identify, diagnose, and resolve issues within your DevOps environments, leveraging monitoring and logging to maintain system stability and optimize performance.
https://www.pluralsight.com/courses/devops-troubleshooting-using-monitoring-and-logging


