Tags
Language
Tags
June 2025
Su Mo Tu We Th Fr Sa
1 2 3 4 5 6 7
8 9 10 11 12 13 14
15 16 17 18 19 20 21
22 23 24 25 26 27 28
29 30 1 2 3 4 5
    Attention❗ To save your time, in order to download anything on this site, you must be registered 👉 HERE. If you do not have a registration yet, it is better to do it right away. ✌

    https://sophisticatedspectra.com/article/drosia-serenity-a-modern-oasis-in-the-heart-of-larnaca.2521391.html

    DROSIA SERENITY
    A Premium Residential Project in the Heart of Drosia, Larnaca

    ONLY TWO FLATS REMAIN!

    Modern and impressive architectural design with high-quality finishes Spacious 2-bedroom apartments with two verandas and smart layouts Penthouse units with private rooftop gardens of up to 63 m² Private covered parking for each apartment Exceptionally quiet location just 5–8 minutes from the marina, Finikoudes Beach, Metropolis Mall, and city center Quick access to all major routes and the highway Boutique-style building with only 8 apartments High-spec technical features including A/C provisions, solar water heater, and photovoltaic system setup.
    Whether for living or investment, this is a rare opportunity in a strategic and desirable location.

    Python for Data Visualization

    Posted By: IrGens
    Python for Data Visualization

    Python for Data Visualization
    .MP4, AVC, 1280x720, 30 fps | English, AAC, 2 Ch | 1h 21m | 187 MB
    Instructor: Michael Galarnyk

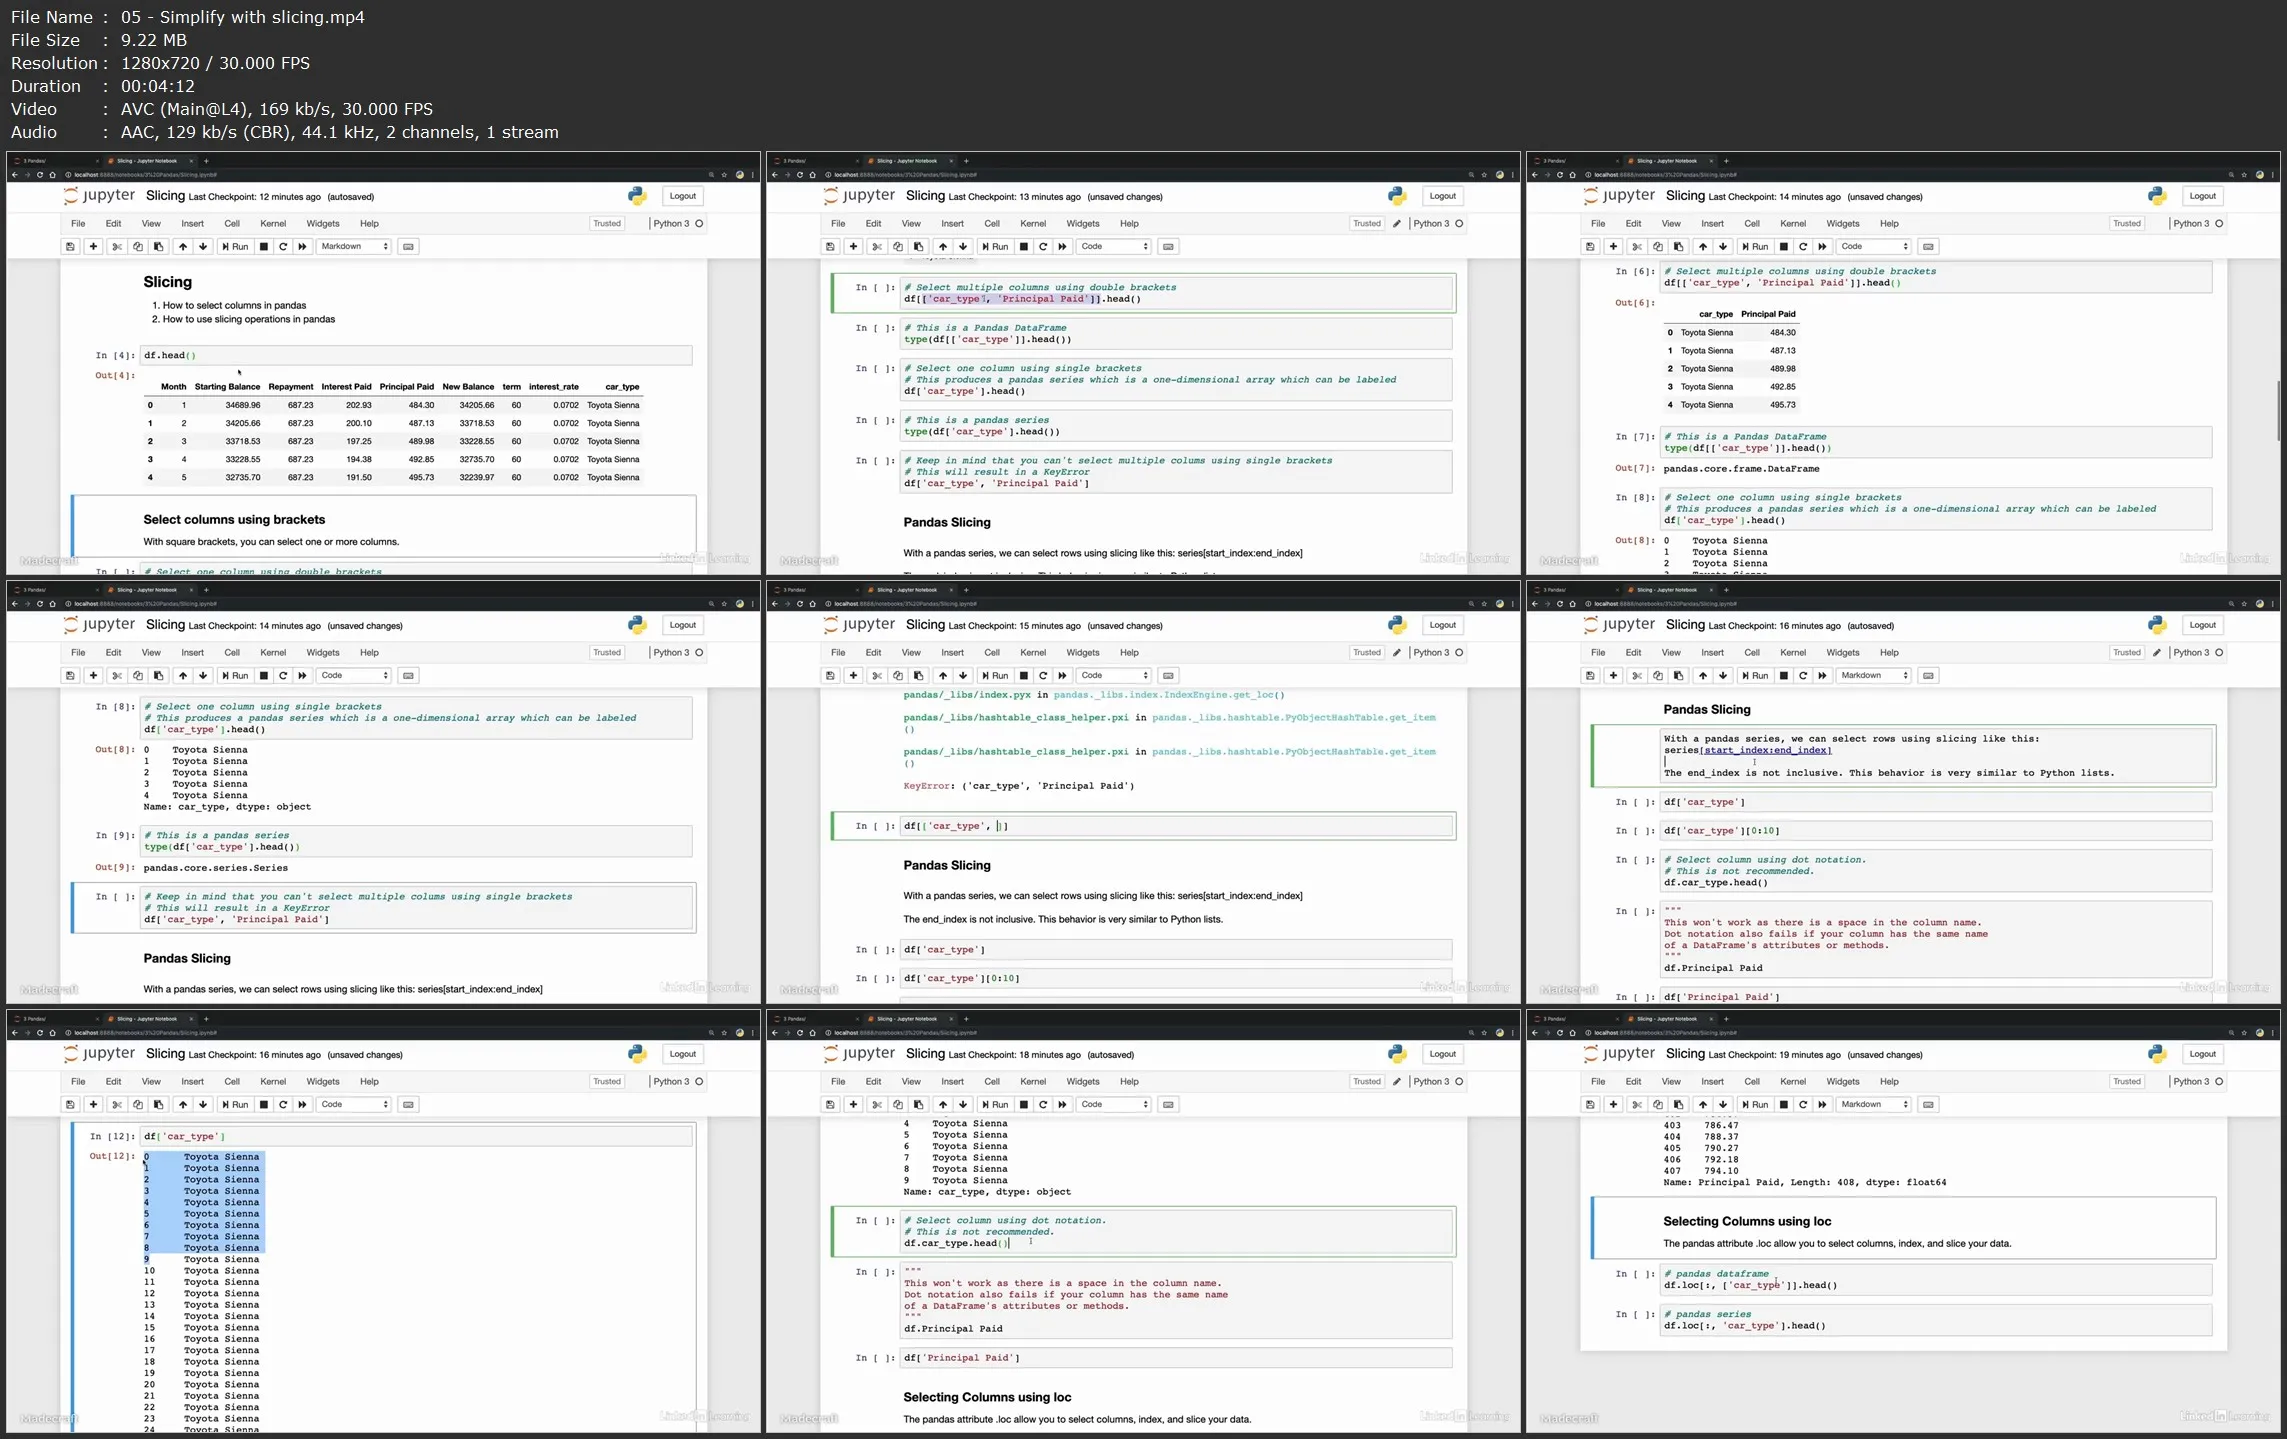
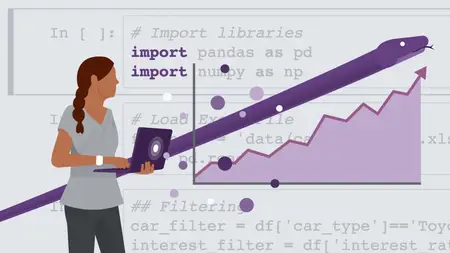
    Data visualization is incredibly important for data scientists, as it helps them communicate their insights to nontechnical peers. But you don’t need to be a design pro. Python is a popular, easy-to-use programming language that offers a number of libraries specifically built for data visualization.

    In this course from the experts at Madecraft, you can learn how to build accurate, engaging, and easy-to-generate charts and graphs using Python. Explore the pandas and Matplotlib libraries, and then discover how to load and clean data sets and create simple and advanced plots, including heatmaps, histograms, and subplots. Instructor Michael Galarnyk provides all the instruction you need to create professional data visualizations through programming.


    Python for Data Visualization