


DataGraph v3.1.1 Mac OS X
DataGraph v3.1.1 Mac OS X | 19.7 MB
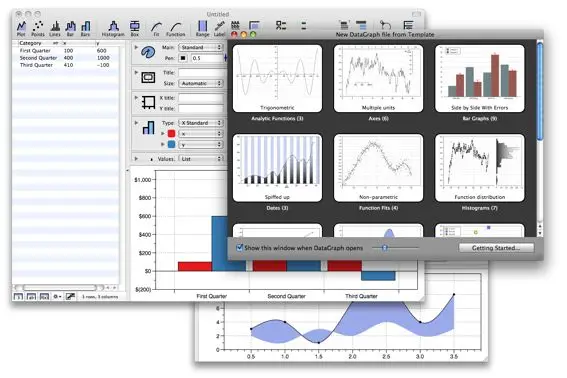
DataGraph is a powerful and easy to use graphing and charting application. DataGraph minimizes the fuss and frustration associated with creating clean and accurate publication quality graphs and charts. DataGraph also includes powerful function fitting and statistical analysis capabilities, which enables high quality analysis of the data. Import data from files, paste in numbers from a spreadsheet, and enter them in manually. Export graphics to files, or copy and paste into presentations. It is a great companion program for spreadsheets.
DataGraph avoids dialog boxes and inspectors. In a single window, you see the data table, drawing commands and the graph they generate. Changes in the data or drawing commands are immediately reflected in the graph. The drawing commands give you quick access to the main settings, and you can toggle them open to see all the settings at once, and don't have to hide them to change something else. There are twenty drawing commands available, and all of them can be used simultaneously, and multiple times. Some draw data from the table, some fit data, compute statistics or are used to annotate or highlight regions of the graph. Everything is specified using exact coordinates so labels will stay at the point where you inserted them even when the axis changes.
A DataGraph file can be used as a work-pipeline, where data is converted into a graph. In this way, multiple data files can be processed to give similar graphs. You can also access this pipeline from within Automator or with the included command line utility.
DataGraph works correctly with multiple formats of calendar dates, such as: "6/15 2002", "15/6 2002" and "June 15, 2002", and automatically picks tick marks that go from years, down to minutes and seconds based on the range.
DataGraph includes a number of data manipulation actions. You can map columns of data using analytical expressions, sort, filter, search+replace and create sub-tables of data. DataGraph has been highly optimized. Tables can have millions of rows, and drawing commands can handle large data sets at interactive speeds so you can resize a graph with hundreds of thousands of line segments just as easily as one with a few points.
A partial list of DataGraph's functionality is:
- Column types are number, string, dates, expression, binary.
- Fit functions: line, polynomial, power, exponential and an arbitrary function with undetermined coefficients that will be optimized.
- Import text files (tab, comma or space separated), netCDF data files, matlab binary files and Cricket Graph data files.
- Export graphics as pdf, eps or bitmaps in any resolution.
- Export animations as QuickTime movies.
- Histogram, including kernel density, and box and whisker plots to analyze distributions. Compute medians, means, standard deviations, etc.
- Plot, scatter, lines, draw analytic functions that can be changed using sliders. All the standard analytical functions are defined.
- Multiple x and y axis, overlapping (e.g. double y) and side by side.
- Multiple fill styles
- CMYK colors
- Unicode support, can write mathematical expressions and easy to add greek characters, superscripts, subscripts.
- Text labels can include statistics and fit results.
- Mask based on labels or values, to draw/fit sub-set of data.
- Vary point color based on data/labels
- Vary point sizes based on data.