

JProfiler 8.0.2 Build 8051
JProfiler 8.0.2 Build 8051 | 68.6 MB
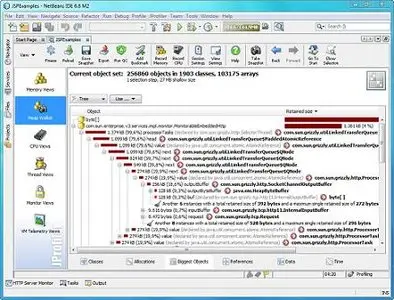
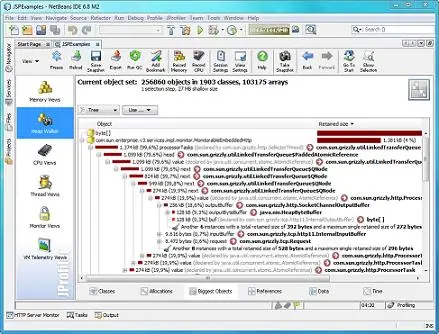
JProfiler is an award-winning all-in-one Java profiler. JProfiler's intuitive GUI helps you find performance bottlenecks, pin down memory leaks and resolve threading issues.
Features
JProfiler supports the following modes of operation:
Live profiling of a local session
Once you define how your application is started, JProfiler can profile it and you immediately see live data from the profiled JVM. To eliminate the need for session configuration, you can use one of the many IDE plugins to profile the application from within your favorite IDE.
Live profiling of a remote session
By modifying the VM parameters of the java start command you can get any Java application to listen for a connection from the JProfiler GUI. The profiled application can not only run on your local computer, JProfiler can attach to a profiled application over the network. In addition, JProfiler provides numerous integration wizards for all popular application servers that help you in setting up your application for profiling.
Offline profiling and triggers
You do not have to connect with the JProfiler GUI to the profiled application in order to profile it: With offline profiling you can use JProfiler's powerful trigger system or the JProfiler API to control the profiling agent and save snapshots to disk. At a later time you can open these snapshots in the JProfiler GUI or programmatically export profiling views with the command line export tool or the export ant task.
Snapshot comparisons
In JProfiler, you can save a snapshot of all current profiling data to disk. JProfiler offers a rich comparison facility to see what has changed between two or more snapshots. Alternatively you can create comparison reports programmatically with the command line comparison tool or the comparison ant task.
Viewing an HPROF snapshot
JProfiler can open HPROF snapshots that have been taken with JVM tools such as jconsole or jmap or that have been triggered by the -XX:+HeapDumpOnOutOfMemoryError JVM parameter.
and muach more …
JProfiler 8.0.2 Build 8051
OS : Windows Vista/7/8, Server 2012/2008/2003, 2000/XP
Language : English
Home Page - http://www.ej-technologies.com